Jan 31, 2014
The Histogram is one of the most useful tools available in Photoshop for viewing and editing the exposure of images. A histogram is a graph which shows the ‘tonal range’ of an image, which is basically the brightness values of an image. A histogram shows how much of an image is pure black (on the very left of the graph) and how much is pure white (the very right of the graph), and the levels of the colours that are somewhere in between.
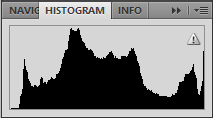
Modifying the tonal range can help improve those images that appear to be a little flat, but before you jump straight in and play around with the brightness and contrast, it is important to take a look at the histogram panel to see where the problem really lies. To view the Histogram panel, open an image in Photoshop (in versions CS3, CS4, CS5 and CS6) and then choose Window > Histogram. By default, as seen in the image below, the bar graph displays.
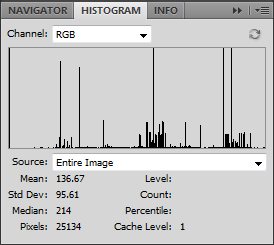
From the Histogram panel’s pop-up menu, you can choose ‘Expanded View’ to show the statistical information displayed in the graph (as seen in the image below). In this view, you can also choose to show the histogram of specific layers from the ‘Source’ pop-up menu (only available in a document with multiple layers). If you choose ‘All Channels View’, a graph for each colour channel is shown separately on the panel.
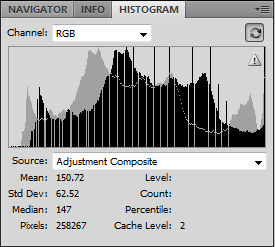
One of the great features about the Histogram panel is that it’s dynamic. As you make tonal corrections with the ‘Levels’ command, you can see a before and after view of the histogram on the Histogram panel. The darker portion on the graph is the adjusted histogram while the faded portion represents the original histogram.
You also have the ability to refresh the histogram display to view the image’s true histogram. Simply click the ‘Cached Data Warning’ button or the ‘Uncached Refresh’ button. Both are located in the upper-right corner of the panel and appear when Photoshop is showing a cached version of the histogram rather than the image’s true histogram. The cached version displays more quickly and requires less memory, but it isn’t completely accurate.
How do your Excel skills stack up?
Test NowNext up:
- Become a pro in SharePoint 2013 with master pages
- 3 helpful tips for Windows 8
- Add flair to your artwork with Illustrator’s Live Trace tool
- Create and lookup custom fields in Microsoft Project
- The fundamentals of styles in Microsoft Word
- WCF vs Web API. How to choose?
- Footprints in the sand
- Master PowerPoint design with Slide & Layout Masters
- Disaster Recovery in Lync Server 2013
- Time saving tips in Microsoft Outlook
Previously
- 5 tips for successful project management
- Configuring users and rights in Lync Server 2013
- Happy Australia Day!
- Give your line art the outline it’s missing in Photoshop
- The Guru is never a Guru in his hometown
- Owning the runway with BI Semantic Model
- Earned Value Analysis with Microsoft Project
- Continuous Integration with Visual Studio
- Flatten Me! I want to be printed!
- The challenges with selling human services
(Part 1)


