


Aug 21, 2014
Power View is a feature of Microsoft Excel 2013 that allows you to create stunning interactive visual presentations of data from multiple sources. In this tutorial we will have a look at how we can represent sales data on a map chart, change the representations, apply filters and create a pie chart.1. Preparing the data
Power View can use data in an Excel spreadsheet or a SQL server database, but in this tutorial we will focus on Excel. To prepare the data ensure it is organised in distinct columns with headers and avoid blank rows/columns. In this example we have sales data for the various products, salespeople and cities in Australia.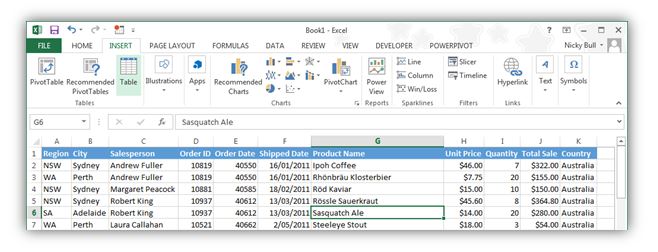
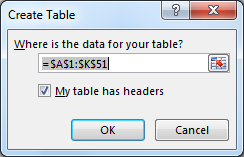 Although it is not necessary, it makes the data easier to work with if it is converted to a table. To do this go to the Insert tab on the ribbon and click Table. The Create Table dialogue will appear, check that the selected range is correct and click OK.
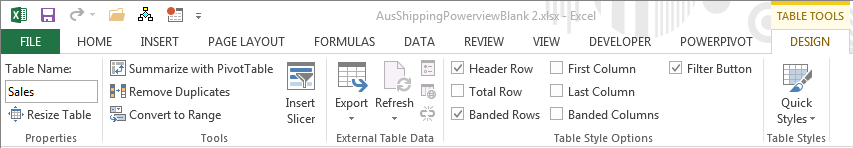
The table will now be formatted and a new tab called Table Tool Design will appear in the Ribbon. To give the table a sensible name, click on the new Design tab and on the far left enter a table name in the Table Name box. In this example we have named it Sales.
Although it is not necessary, it makes the data easier to work with if it is converted to a table. To do this go to the Insert tab on the ribbon and click Table. The Create Table dialogue will appear, check that the selected range is correct and click OK.
The table will now be formatted and a new tab called Table Tool Design will appear in the Ribbon. To give the table a sensible name, click on the new Design tab and on the far left enter a table name in the Table Name box. In this example we have named it Sales.
2. Create a Power View Map
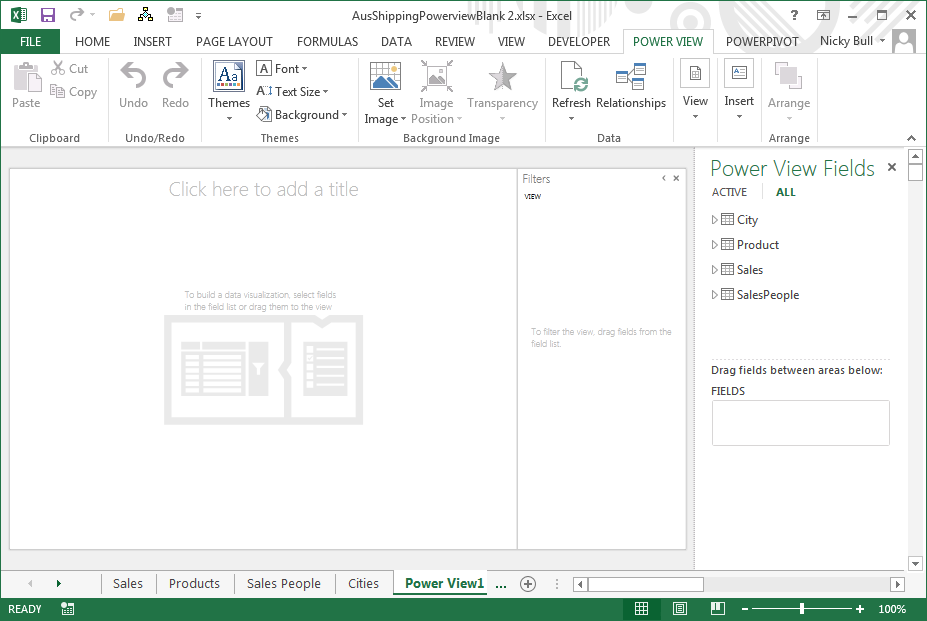
To create the Power View report from scratch click in any blank cell, go to the Insert tab and select Power View.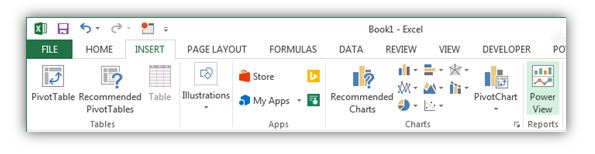 A new worksheet will be automatically created showing a placeholder in the centre of the worksheet and the Power View Fields panel on the right. Any tables in your workbook will appear listed in the Power View Fields panel.
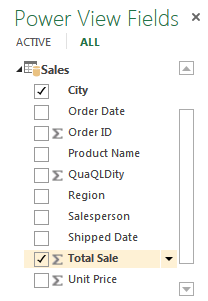 To see the fields available in a table click on the twisty (small white arrow) to the left of the table name. In this example we will expand the Sales table.
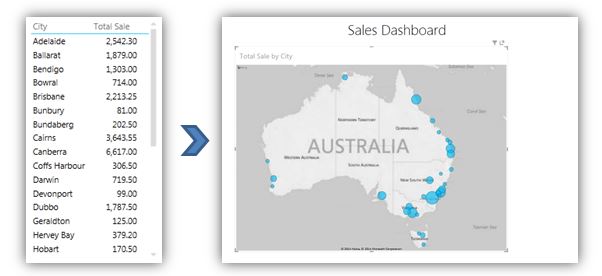
Next place a tick in the boxes of the data you wish to represent, in this case we will tick City and Total Sale to get a summary of total sales for each city.
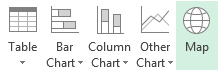
Notice that the placeholder is now replaced with a summary of the selected data. For a more graphical representation, ensure the table is selected, go to the Design tab on the ribbon and click on Map.
To see the fields available in a table click on the twisty (small white arrow) to the left of the table name. In this example we will expand the Sales table.
Next place a tick in the boxes of the data you wish to represent, in this case we will tick City and Total Sale to get a summary of total sales for each city.
Notice that the placeholder is now replaced with a summary of the selected data. For a more graphical representation, ensure the table is selected, go to the Design tab on the ribbon and click on Map.
 Resize the map by dragging the black handles on the sides/corners and give your report a sensible title.
3. Different Representations
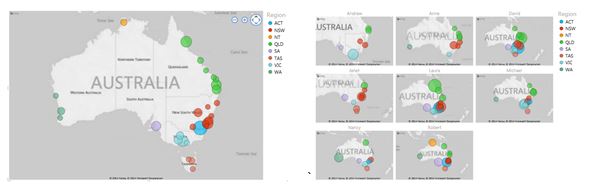
To see a breakdown of sales by salesperson, put a tick next to Salesperson in the Pivot View Field List. Notice how each sales bubble is broken into a pie chart showing the sales distribution by salesperson. Now click on one of the names in the legend, that person’s sales are immediately highlighted.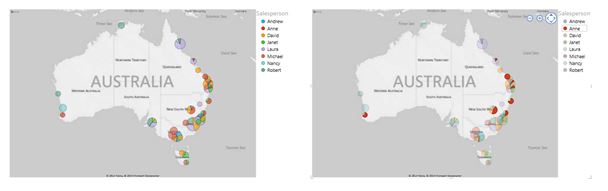 Alternatively we can categorise the cities into areas by un-ticking Salesperson and ticking Region instead. Now tick Salesperson again to get a breakdown by Region and Salesperson.
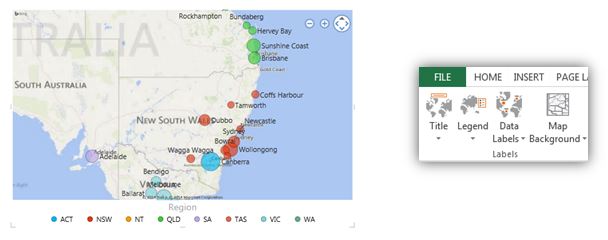
 You can also change the map background, change the position of the legend or add data labels by going to the Layout tab and clicking the appropriate button in the Labels group.
4. Add Filters
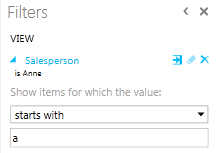
To add a filter, simply drag the field you wish to filter by from the field list and into the Filters pane. For example, if we want to filter the data, so that we can just see the sales data for Anne, we drag Salesperson to the Filters pane and then put a tick next to Anne.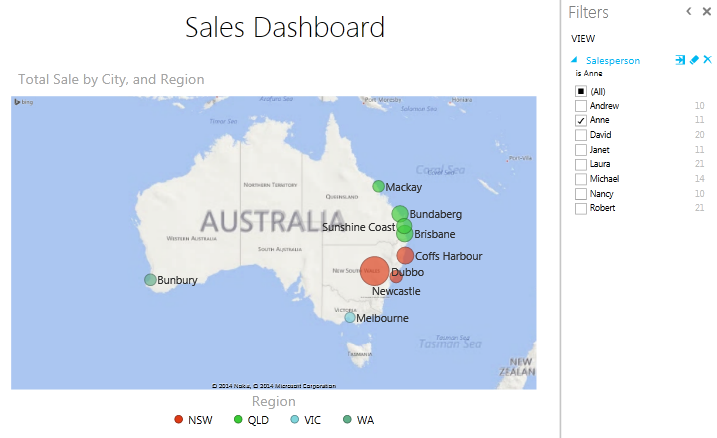 You can clear filters by clicking on the clear filter button or apply more advanced filters by clicking on the Advanced Filter button.
5. Add a Pie Chart
Power View is not limited to just map views and can show the data in many different representations simultaneously. For example, we may also wish to include a pie chart to show a clear breakdown of total sales across different regions.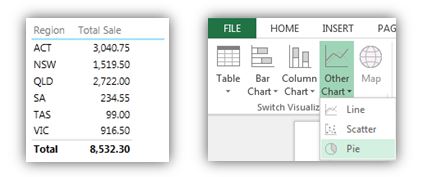 To do this, click away from the map so it is no longer selected. In the Power View Fields pane tick Region and Total Sale. A table, much like the first, appears to the right of the Map. With the table still selected go to the Design tab, click Other Chart and select Pie. A pie chart will now replace the table.
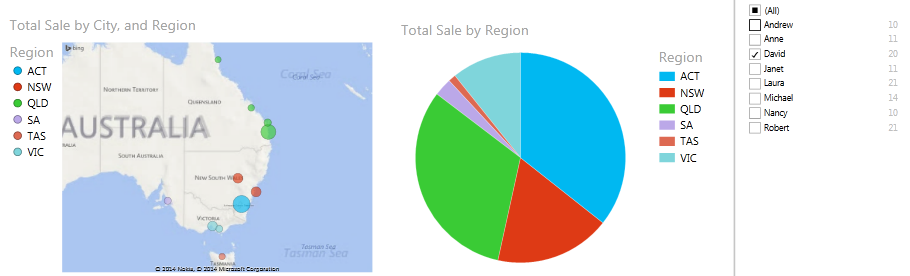 Notice that when you now filter on Salesperson both the map and the pie chart change to show only the filtered data.
And there, without any complex formulae, you have the beginnings of a stunning graphical interactive dashboard or report.
Notice that when you now filter on Salesperson both the map and the pie chart change to show only the filtered data.
And there, without any complex formulae, you have the beginnings of a stunning graphical interactive dashboard or report.
How do your Excel skills stack up?
Test NowRelated Articles


About the Author:
Nicky Bull

Nicky started her professional life over 19 years ago in the IT industry. Through the initial years of her career, she worked in the areas of software development & project management for some of the leading organisations in South Africa and U.K. Over the past 6 years, Nicky has been working as a Desktop Applications trainer, delivering courses to both corporate as well as government organisations across the entire Microsoft Office suite. Her approach to training delivery is very pragmatic and she finds immense fulfilment in her ability to assist other people with their growth and development.
Read full bio


Next up:
- Xbox, oh Xbox, give me media!
- Using background pages in Visio 2010 & 2013
- Why would I or my company want to use SCCM?
- Communication Across Generations – Quiz
- 5 steps to create a custom field in Microsoft Project
- Setting up your first Office 365 Tenant account
- Heading styles in Microsoft Word
- Voice Resiliency Features of Lync Server 2013
- The Silver Rule of Negotiation
- Create an advanced filter in Excel
Previously
- Never, ever let individual power bring your team down
- The basics of cloud computing
- How to create a simple Waterfall chart in Excel
- An epiphany about the cloud
- Networking requirements planning in Lync Server 2013
- 4 techniques to improve your active listening skills
- The enhanced Presenter View in PowerPoint 2013
- Synchronising concurrent access to data in C#
- Easily delete blank rows from your data using Excel VBA
- Run the Runbook Tester in System Center 2012 R2
