

Feb 18, 2014
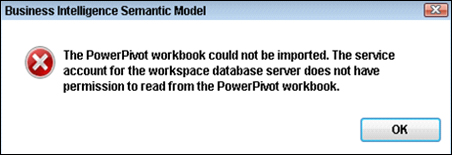
Have you tried using Excel’s PowerPivot? For those of you who have, it’s awesome, isn’t it? If you haven’t, have a crack, you’ll find the experience rewarding. What I wanted to discuss today are some minor hiccups when you use PowerPivot workbooks, or more specifically, when you want to upgrade those workbooks to a full-blown Tabular Data Model in Analysis Services. Wait…what? You didn’t know you could do that? First, let’s take a step back and see what I’m talking about. PowerPivot is an Add-In for Microsoft Excel 2010. It uses the excellent xVelocity engine to store all your data in memory in a highly compressed state. Storing something in memory is going to work a lot faster than if it were on disk, but the data is also compressed. Now, I can hear some of you saying “how is that going to make it faster, surely the compressing/decompressing takes up a lot of time?” Well, it does, but comparatively little when you look at the performance gained from reading compressed data. Let’s have a look at an analogy I like to use. Imagine you have to run 100m, and you’re able to run at 10m/s, meaning you will traverse that 100m in 10 seconds. Now I’m going to compress the data you have to read (or in this case, shorten the distance you have to run) to 10% of the original. So you only have to run 10m now instead of 100m. Unfortunately, there’s a small head-wind of 2m/s that means you can only travel at 8m/s (that’s the overhead from compressing/uncompressing). You’re actually running slower now, but the distance you have to traverse is very much smaller. Now, you will traverse that 10m in 1.25s which is much faster especially considering your velocity is lower. Good with that? Excellent. Let’s go back to Excel. Reading highly compressed data stored in memory is substantially faster than reading uncompressed data on disk. This is what PowerPivot does for you (and incidentally what Hekaton will do for your OLTP systems in SQL Server 2014). Now, there will possibly come a point in time when your desktop doesn’t have enough RAM for the data you’re trying to analyse (even in a highly compressed state); or you want to share your magnificent creation with your team members; or you want to take advantage of some of the features of an Analysis Services Tabular Data Model that you simply can’t do in your PowerPivot for Excel workbook (Row Level Security or DirectQuery Mode for example). Fortunately, there is an upgrade path for you. To upgrade, you would simply open SQL Server Data Tools (BIDS by another name) and create an Analysis Services Tabular Data Model project then import your Excel workbook. Nice and easy! However, you might encounter one or two issues that’ll occur from time to time. Fortunately, again, there are easy fixes to these that I’ll go through below. Problem #1:
How do your Excel skills stack up?
Test NowRelated Articles


About the Author:
Adam Keats

With over 25 years of real-world IT experience Adam is one of New Horizons’ most senior Database and Software Development trainers. Starting out as a physics teacher Adam displayed exceptional mathematical and technical capabilities early on in his career. He went on to work in a variety of programming and technical management roles within several government agencies including the Department of Defence and Maritime Patrol. In 1998 Adam found his true calling, gaining MCT status and thus beginning his technical training career specialising in SQL Server administration, development, BI, and .NET development. Since then he has worked for several training organisations and found a home at New Horizons where he is now our resident Database and Development specialist. Throughout his tenure at New Horizons, Adam has assisted over 500 students in their endeavours to improve their skills, knowledge, and to achieve industry certifications.


Next up:
- I’ve got a hang up; I can’t communicate
- What Lies Beneath – Part 1
- The new “share” feature in SharePoint 2013
- Saving a file with a unique name in Excel VBA
- Get-Help – the PowerShell Way
- No wonder my sales were down; I thought AIDA was an Italian Opera!
- What Lies Beneath – Part 2
- How to sort lists with multiple levels in Excel
- A Closer Look at Excel PowerPivot and Power View
- Creating Building Blocks in Microsoft Outlook
Previously
- Time saving tips in Microsoft Outlook
- Disaster Recovery in Lync Server 2013
- Master PowerPoint design with Slide & Layout Masters
- Footprints in the sand
- WCF vs Web API. How to choose?
- The fundamentals of styles in Microsoft Word
- Create and lookup custom fields in Microsoft Project
- Add flair to your artwork with Illustrator’s Live Trace tool
- 3 helpful tips for Windows 8
- Become a pro in SharePoint 2013 with master pages
