


Jan 31, 2014
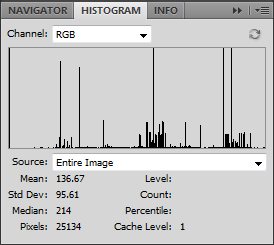
The Histogram is one of the most useful tools available in Photoshop for viewing and editing the exposure of images. A histogram is a graph which shows the ‘tonal range’ of an image, which is basically the brightness values of an image. A histogram shows how much of an image is pure black (on the very left of the graph) and how much is pure white (the very right of the graph), and the levels of the colours that are somewhere in between.
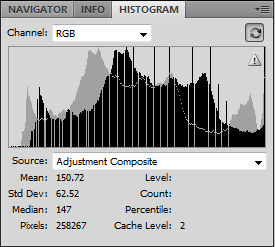
Modifying the tonal range can help improve those images that appear to be a little flat, but before you jump straight in and play around with the brightness and contrast, it is important to take a look at the histogram panel to see where the problem really lies. To view the Histogram panel, open an image in Photoshop (in versions CS3, CS4, CS5 and CS6) and then choose Window > Histogram. By default, as seen in the image below, the bar graph displays.

How do your Excel skills stack up?
Test NowRelated Articles


About the Author:
New Horizons

New Horizons is Australia’s leading corporate training provider, and has been educating business professionals for over 15 years in the areas of Professional Development, Microsoft Office & Adobe Applications, and IT Technical. Our aim through this blog is to bring you relevant stories, articles, and tips & tricks that can help you to improve your skills and productivity in the workplace. Our expert trainers will also be posting their own articles from time to time, so be sure to keep an eye out.
Read full bio


Next up:
- Become a pro in SharePoint 2013 with master pages
- 3 helpful tips for Windows 8
- Add flair to your artwork with Illustrator’s Live Trace tool
- Create and lookup custom fields in Microsoft Project
- The fundamentals of styles in Microsoft Word
- WCF vs Web API. How to choose?
- Footprints in the sand
- Master PowerPoint design with Slide & Layout Masters
- Disaster Recovery in Lync Server 2013
- Time saving tips in Microsoft Outlook
Previously
- 5 tips for successful project management
- Configuring users and rights in Lync Server 2013
- Happy Australia Day!
- Give your line art the outline it’s missing in Photoshop
- The Guru is never a Guru in his hometown
- Owning the runway with BI Semantic Model
- Earned Value Analysis with Microsoft Project
- Continuous Integration with Visual Studio
- Flatten Me! I want to be printed!
- The challenges with selling human services
(Part 1)
