


Mar 31, 2016
Every management wants to increase the company’s profit over time. How can they do that? Well, by setting scenarios. Management can look at company’s Revenue and Expenses and they can play with the figures to see which scenario will give them the highest return in profit.
You can create several scenarios with Microsoft Excel using Scenario Manager feature.
Let’s say we use the spreadsheet below to set scenarios.
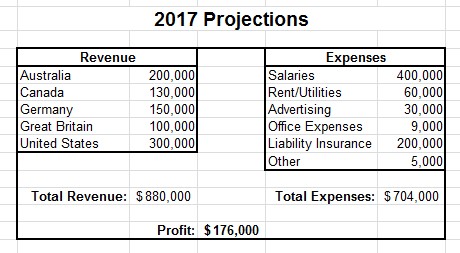
In this example, the total profit is $176,000. To increase this profit, we can do one of the following:
- Increase revenue
- Decrease expenses
Question is: how can we increase the revenue and how can we decrease the expenses?
We can add more money in advertising expenses, say another $10,000 and because we will reach more people, the revenue should increase. By how much? Assume we did our research and we believe that each country’s revenue will increase by 9.95%. I will name this scenario Advertising Push.
In the second scenario I will decrease some expenses. We will assume that I did a little research and I did find cheaper:
- Liability insurance
- Rental property (this was a real case scenario years ago when HP company moved from North Sydney to Rhodes and they saved lots in rental)
We can also save in office expenses by reducing waste. The Other expenses type can also be reduced by eliminating unnecessary expenses.
First of all, we have to save the original figures so we can return to the original values.
To create scenarios, follow the steps listed below:
- Select the Revenue and the Expenses numbers/values
- Click the Data tab on the Ribbon
- Go to Data Tools group
- Click the What-If Analysis button
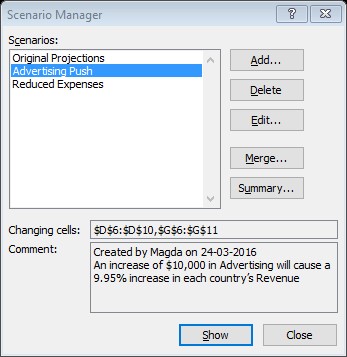
- Click the Scenario Manager… button
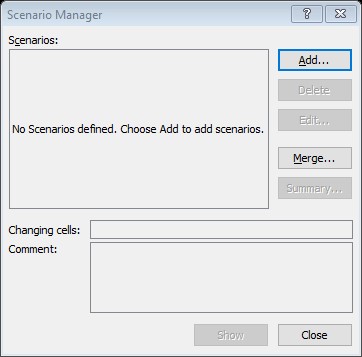
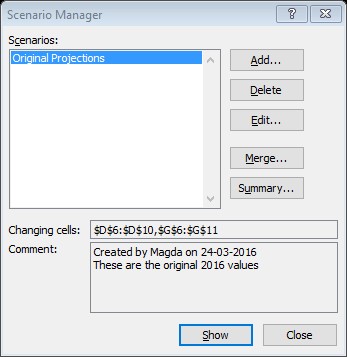
- The following dialog box will display:
- Click the Add… button
- Type Advertising Push for the scenario name
- Add the following comment: An increase of $10,000 in Advertising will cause a 9.95% increase in each country’s Revenue
- Click OK. The Scenario Values dialog box opens. The Advertising value is in cell G8.
- Change the G8 value from $30,000 to $40,000. This is an increase of $10,000 in Advertising.
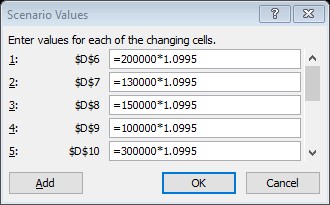
- Scroll all the way up in the Scenario Values dialog box in order to display the Revenue fields and add the 9.95% increase in Revenue values.
- In the Scenario Values dialog box, Click in front of the value for $D$6 cell reference and type the equal sign (=)
- Click after 200000 and type the star (*) sign for multiplication
- Type 1.0995 (the 9.95 % increase)
- Do the same for the $D$7, $D$8, $D$9 and $D$10 Note: You can select the *1.0995, then copy and paste it after the other 4 cells containing the revenue values.
- Your dialog box should look like the one below:
- Click OK. You will get this dialog box:
- Click OK again. We have the second scenario.
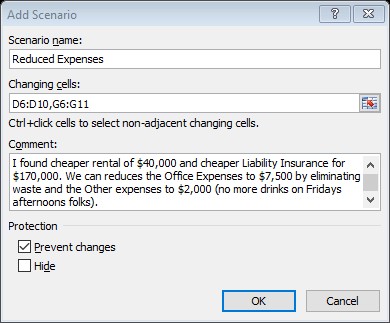
- Click the Add… button
- Type Decreased Expenses for the scenario name
- Add the following comment: I found cheaper rental of $40,000 and cheaper Liability Insurance for $170,000. We can reduces the Office Expenses to $7,500 by eliminating waste and the Other expenses to $2,000 (no more drinks on Fridays afternoons folks)
- Click OK. Scroll down until you see the $G$7 field for Rent/Utilities
- Change the value from 60000 to 40000
- Change the value for $G$9 from 9000 to 7500 (Office Expenses reduction)
- Change the value for $G$10 from 200000 to 170000 (Liability Insurance reduction)
- Change the value for $G$11 from 5000 to 2000 (Other Expense reduction)
- Click OK. You have the 3 scenarios listed.
- Select the scenario name you want to show, say Advertising Push
- Click the Show button
- Select the Reduced Expenses scenario
- Click the Show button

To add our first scenario, click the Add… button. You will be faced with this dialog box:
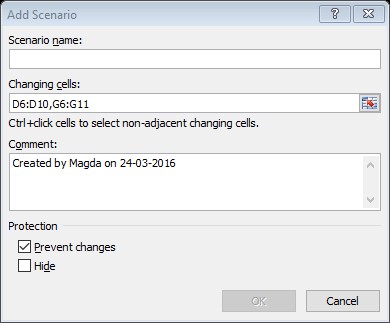
In the dialog box displayed, type the scenario name Original Projections and add a comment as shown in the figure below.

Click OK. The next dialog box opens.
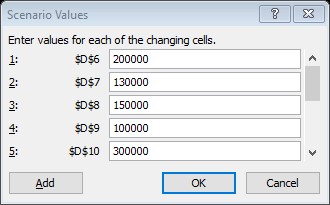
Click OK to save the original values. We have our first scenario.
To add the next scenario, follow the steps listed below:
Note: If you type in the new 9.95% increased values, you will most likely need a calculator to add this increase to each revenue stream, which is time consuming. To force Excel to calculate the new increased values, follow the steps below:
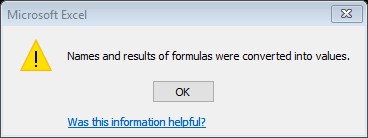
Microsoft Excel makes the calculations for you.
Now we will create the 3rd scenario.
To show the scenarios:
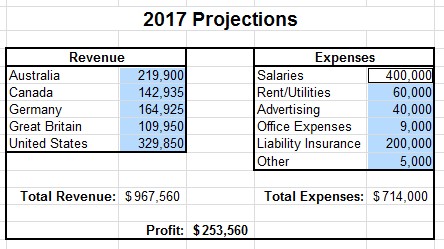
This scenario gives us $ 253,560 in Profit. The Original Scenario Profit was $176,000
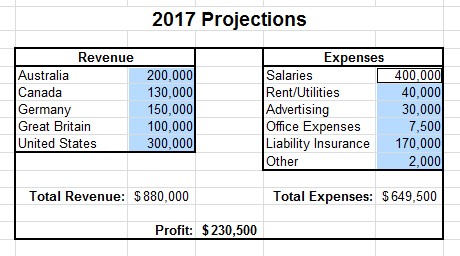
This scenario gives us $ 230,500 in Profit. So the Advertising Push scenario will produce the highest Profit for the company. The company’s management can now make a decision on which scenario to implement.
My next blog about Scenarios will show you how to create a professional Scenario Summary report that you can print out for the management.
How do your Excel skills stack up?
Test NowRelated Articles


About the Author:
Magdalena Todor

With over 20 years experience as a facilitator and university lecturer, Magda is one of our most senior and experienced trainers. With previous practical on the job experience as a project manager she embodies a brilliant balance of training experience and business knowledge. With every event she delivers, Magda takes a wholehearted approach to ensure every course is impactful, relevant and a genuinely positive learning experience for all.
Read full bio


Next up:
- Protecting Confidential Data with Symmetric Encryption
- Master Managers are Master Planners
- How SharePoint works with Active Directory
- Handling non-performing employees fairly and with common-sense
- Creating Custom Shows in PowerPoint
- Protecting Confidential Data with Symmetric Encryption - Part 2
- How to create Microsoft Excel Scenarios Summary Report
- Creating a Point-to-Site VPN to your Azure Virtual Machines
- The future is here
- Tune Your SSD for Windows 10
Previously
- Who is a bad boss then?
- Fundamentals of Microsoft Azure
- Why is it so hard to apologise?
- Using a model in your AngularJS form
- Corruption found in Professional Development training company
- More PowerShell Constructs and Loop Management
- Leaping over communication hurdles
- Excel Keyboard Shortcuts
- Talking Tactics
- Persistent chat server role in Skype for Business
