

Sep 16, 2016
Efficient Project Management involves displaying the project plan in a visual format. The tool used to do this is called the Gantt Chart. The Gantt Chart is a list of tasks drawn across a time scale using shaded cells. It shows the start date and the end date of each task. It helps the Project Manager to identify dependencies between project tasks. It also helps the user to develop a project plan schedule with check points.
A Gantt Chart is a very useful tool in monitoring and controlling the project progress which is a crucial task in Project Management. With the help of this tip, you can easily create a project plan that includes a Gantt Chart in Microsoft Excel if you do not use any other project management software.The Gantt Chart in Excel is only suitable for very short projects for 1 month or less. It is not suitable for longer projects as it is not accounting for public holidays and weekends.
To find out more on our BSB51415 – Diploma of Project mananagement click here.
Follow the steps listed below in order to create a Gantt Chart:
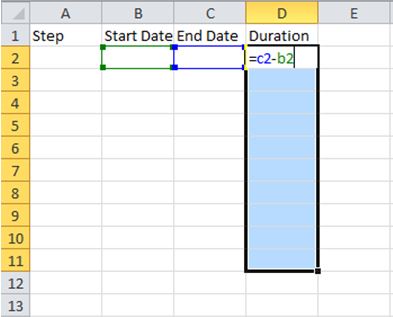
- Select cell A1, type Step.
- Select cell B1, type Start Date.
- Select cell C1, type End Date.
- Select cell D1, type Duration.
- Select cells D2:D11 and type the formula =C2-B2 to calculate the difference between tasks the End Date and the Start Date.
- Press CTRL +Enter to enter the formula to all selected cells.
- Select cell E1 and type the formula =B2.
- Select cells F1:AB1 and type the formula =E1+1 to enter the calendar days.
- Press CTRL +Enter to enter the formula to all selected cells.
- Select cells E2:AB11.
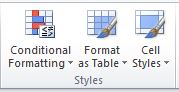
- On the Home tab, Styles group, click Conditional Formatting and then New Rule.
- Select Use a formula to determine which cell to format option.
- Type the formula =AND(E$1>=$B2, E$1<=C2).
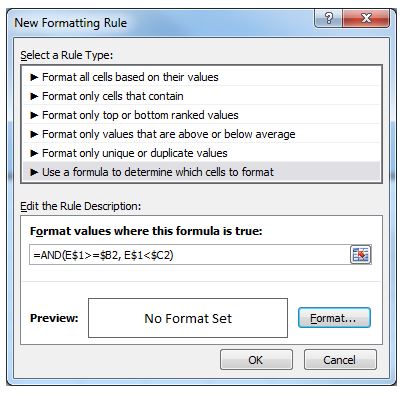
- Click the Format button.
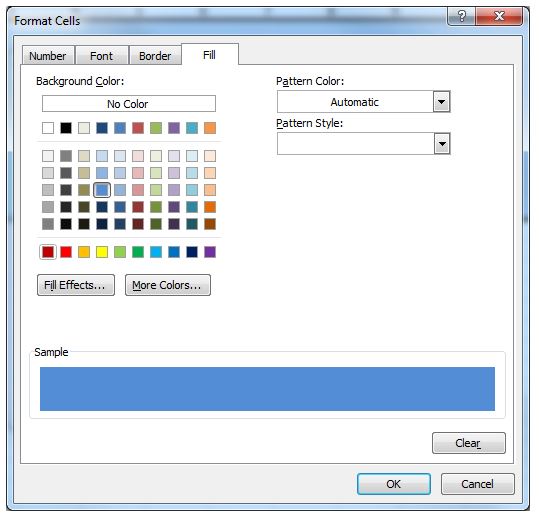
- Click the Fill tab.
- Select a blue colour.
- Click OK, then click OK again.
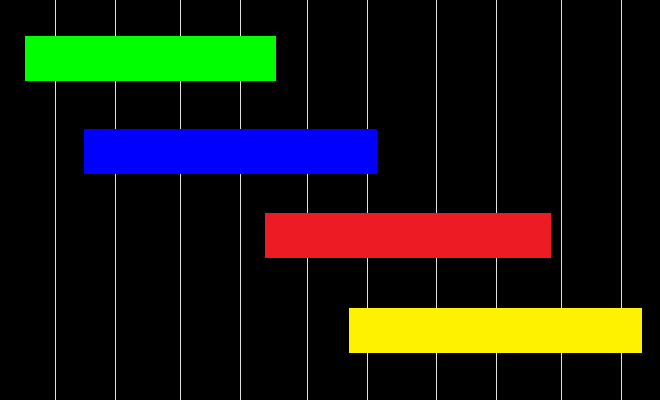
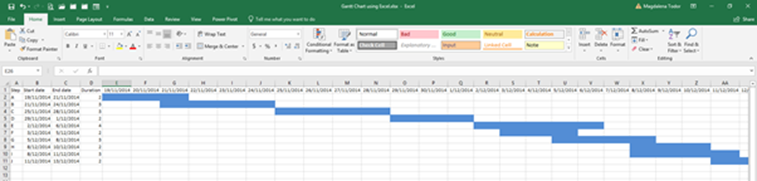
Your Gantt Chart should look like the figure below.

How do your Excel skills stack up?
Test NowRelated Articles


About the Author:
Magdalena Todor

With over 20 years experience as a facilitator and university lecturer, Magda is one of our most senior and experienced trainers. With previous practical on the job experience as a project manager she embodies a brilliant balance of training experience and business knowledge. With every event she delivers, Magda takes a wholehearted approach to ensure every course is impactful, relevant and a genuinely positive learning experience for all.
Read full bio


Next up:
- The first tool of Power BI
- Reduce those pesky meeting request response messages in Outlook
- What’s new in Windows Server 2016 Hyper-V
- 10 habits of highly effective social sellers (Infographic)
- See the blue through the clouds with Microsoft Azure!
- Convert imagination into art with Adobe Capture
- How-to: Make dates and currency in Excel show properly in a Word Mail Merge (Part 2)
- Create cascaded dropdowns in Nintex forms
- Story-Telling leads to Story-Selling: From Content to Insights to Revenue (Infographic)
- How to get the most out of Outlook
Previously
- The first tool of Power BI
- How-to: Add public holidays to a Microsoft Project 2013/2016 calendar
- What they don't tell you about becoming a manager
- Have you got bubbles?
- Mastering InDesign
- 3 TED talks on habit
- How-to: Promote a Sub-Site to a Top-Site in SharePoint 2013
- Automate your website publishing process using Github and Azure
- Excelling in Excel
- How to improve your business writing
